✦ FOR HR & PEOPLE PROFESSIONALS

Compensation tools that help you enable managers, not chase them

500+ 5 Star Reviews

Give your managers the context and guardrails they need to make good pay decisions — while keeping governance, equity, and compliance in your hands.

Get a Demo
1AI Search
2Market Pricing
3Trends & Demand
Find any job, fast
Search in plain language — Payscale maps it to the right role and market.
AI-powered search
Firmware / Embedded Software Engineer
Technology USA — National 500–1,000 employees
Suggested matches
Firmware Engineer II
USA — National · Technology
Embedded Software Engineer
USA — National · Technology
IoT Firmware Developer
USA — National · Technology
Price the role in real time
A live pay distribution, benchmarked to fresh market data.
Market distribution
Firmware / Embedded Software Engineer · USA
10TH 25TH 50TH 75TH 90TH $88.1K $96.2K $107.2K $132.8K $158.9K
50TH · MEDIAN
$107.2K
Range
$88K – $159K
10th to 90th percentile
Data analyzed
Firmware/Embedded SW Eng · USA 98 orgs · 2,221 incs
Firmware/Embedded SW Eng · Technology 10 orgs · 134 incs
Explore trends and demand
Skill premiums, hiring momentum, and where the jobs are.
Skill impact
Pay lift for in-demand skills
Embedded C/C+++12%
RTOS+8%
Device drivers+5%
Bluetooth LE+3%
Skill trends
% of postings, last 7 quarters
Embedded C/C++ RTOS Device drivers Bluetooth LE
Demand · job postings
Postings over last 8 quarters
Q2 ’24Q4 ’24Q2 ’25Q4 ’25
Demand · top locations
Postings & median by metro
San Jose, CA532$195.1K
Los Angeles, CA309$167.7K
Seattle, WA188$176.6K
Boston, MA182$145.2K

The HR reality no one talks about enough

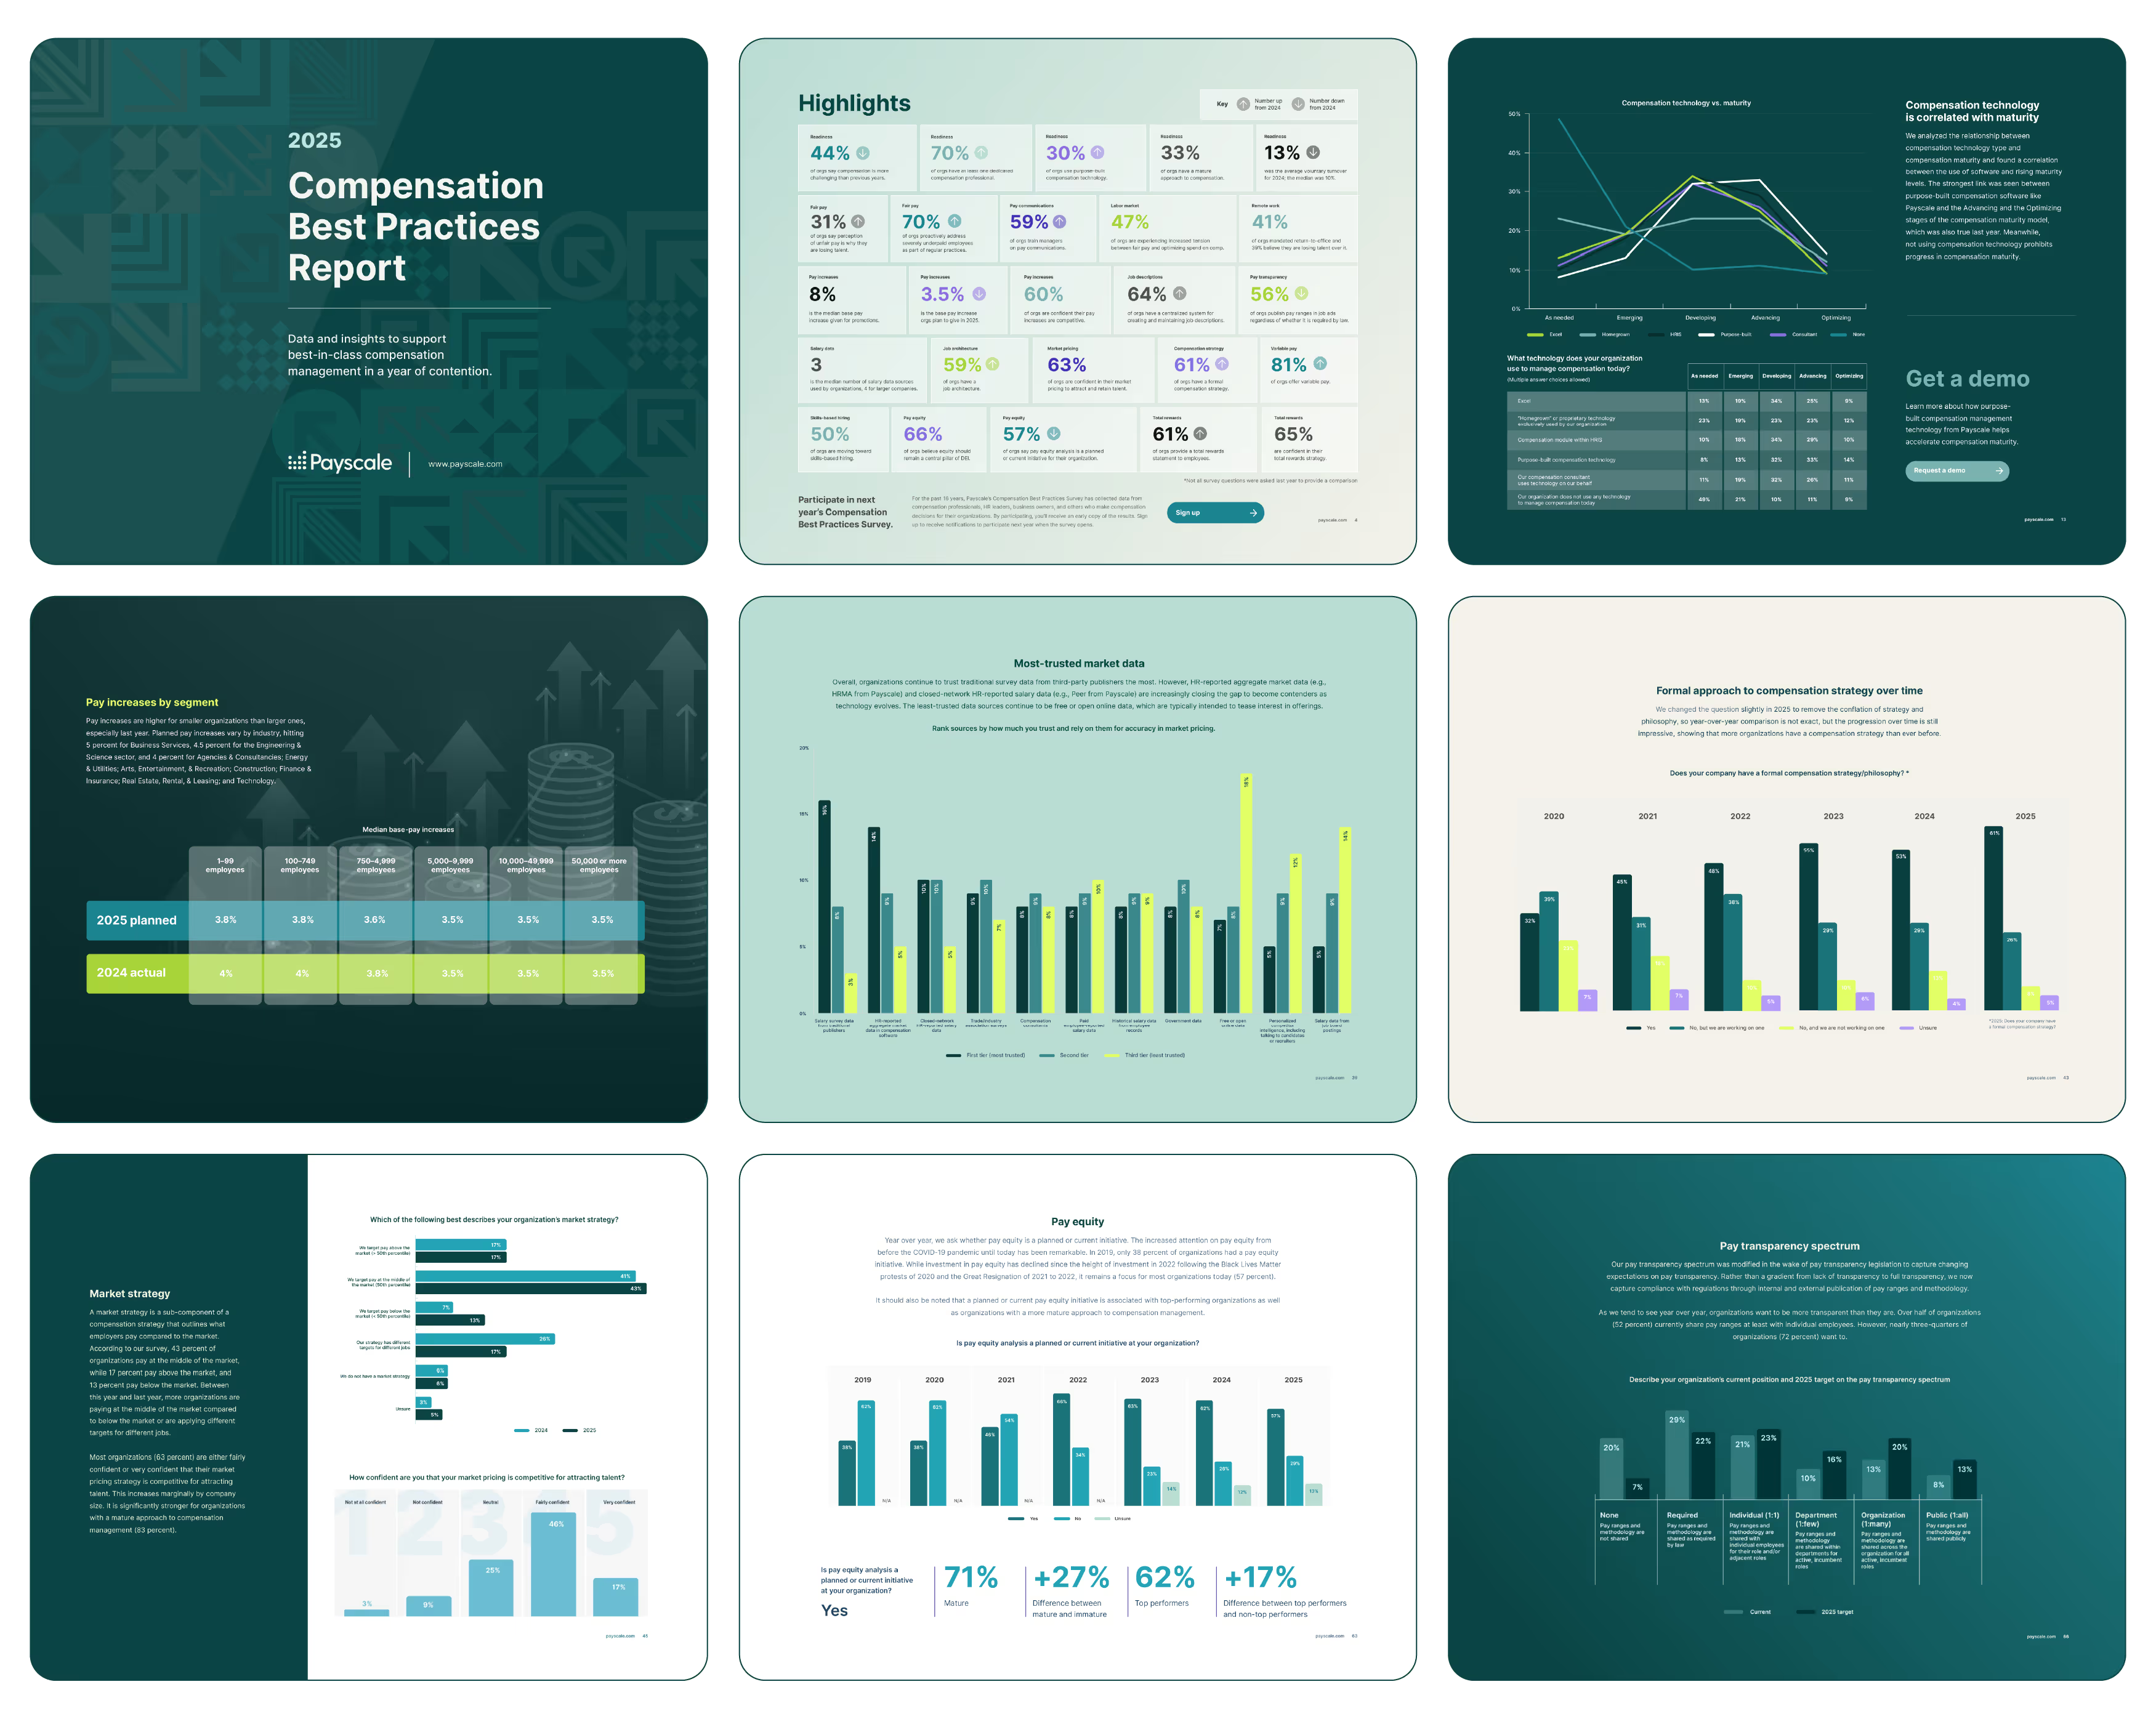
According to Payscale’s 2026 Compensation Best Practices Report, HR and People teams are caught between enabling managers and maintaining governance — but most compensation tools were built for compensation professionals, not the people who actually have to make the system work day-to-day.

64
%

of organizations still conduct pay equity analysis primarily in spreadsheets

65
%

of organizations are confident in their market pricing strategy

75
%

are confident that their pay increases are competitive for retaining and engaging talent

Powered by
29
Industries
10M+
Employee Records
4.5K+
Contributing Orgs
00+
New Metric 5
00+
New Metric 6
00+
New Metric 7
00+
New Metric 8
Built for
Benchmarking
Compensation Planning
Job Management
Pill 4
Pill 5
Pill 6
Pill 7
Pill 8
Made for
Compensation Professionals
HR Professionals
Executive Leadership
Talent Acquisition
Pill 5
Pill 6
Pill 7
Pill 8
✦ Meet the Payscale Intelligence Cloud

 Get intelligence that turns HR into a strategic partner — not just a support function

Most HR teams sit in the middle — asked to enable managers while also protecting the organization, often caught between Comp, Talent Acquisition, and leadership.

Payscale Intelligence Cloud helps your Comp, HR, and Talent Acquisition teams work from the same reliable data and job architecture — giving you the clarity and credibility to guide decisions instead of constantly chasing answers across silos.

Benchmarking that gives you credibility with managers

Quickly access reliable, role-specific market data from Peer Global — real employer-reported compensation data refreshed daily. This turns compensation conversations from reactive requests into proactive guidance and positions you as a trusted advisor rather than the person who has to go find the answer.

Compensation planning that reduces last-minute chaos

When job levels and market data are connected in one governed system, you stop getting pulled into urgent modeling requests right before budget deadlines. You gain better visibility into how proposed increases align with both internal equity and current market movement — so you can partner with leadership earlier and avoid being the bottleneck or the firefighter.

Job architecture that cuts down on ad-hoc work across teams

One consistent job structure means Recruiting, Comp, and HRBPs are all working from the same definitions instead of reconciling conflicting information. You spend less time clarifying “what level is this role really?” and more time focusing on higher-value work like workforce planning, internal mobility, and manager coaching.

Give managers the tools to make good decisions


Stop being the bottleneck. Provide managers with guided compensation recommendations, clear guidelines, and real-time context — while you maintain oversight and governance.

  • Manager-friendly workflows with built-in guardrails
  • Real-time market data and internal equity context at the point of decision
  • Clear audit trails so you can see what was proposed and why
Outcome
Managers feel supported. You stay in control.
1Ask Anything
2Analyze Insights
3Drive Decisions
Query data, in plain language
Ask the way you'd say it — get a report back.
Generate a report showing pay equity by department
Asking about: Compensation data
Ask
Try asking
Average compa-ratio by job family?
Top 10 jobs with low pay outliers?
Who's paid below their range minimum?
Which jobs aren't market-priced?
New-hire vs. tenured pay in the same title?
Surface key findings
Your question becomes a live, drillable report.
Show gender pay gaps by department, descending
Pay gap by department
Sales
−3.2%
Engineering
−2.4%
Marketing
−1.8%
Finance
−1.1%
Operations
−0.6%
Avg. gap closed
−2.1%
YoY across all departments
Employees above midpoint
68.4%
4.2 pts vs last quarter
Roles ready to price
1,247
Updated this morning
Benchmark with confidence
Analysis becomes a defensible, costed action plan.
Market intelligence
Insight
Engineering salaries trail market by 3.8% — top-quartile risk in 14 roles.
Pay equity signal
Insight
Gap closing fastest in Marketing — −1.8% YoY. Sales needs attention next.
Recommended action
Act now
Allocate $420K across 14 engineering roles to close the gap and protect retention.
Projected outcome
Retention up. Risk down. Budget defended.
22%
Lower flight risk for top performers
$1.4M
Avoided cost of unwanted attrition
1Untangle
2Govern
3Power
Untangle messy job data
Titles drift, levels go missing, and the same role lives in five places.
Sr. Analyst
No level
Analyst II
No family
Acct Coordinator
Outdated
AP Specialist
Duplicate
Manager, Fin.
No level
Coordinator
Missing skills
25
job-data issues flagged across your org
23 missing skills 2 no job family inconsistent downstream
Build one governed structure
Every role mapped to a family and a consistent, comparable level.
Job Architecture
Finance
U2Coordinator
P2Specialist I
M1Manager
Engineering
P2Engineer II
P3Senior Eng
M2Eng Lead
Sales
P1Associate
P3Account Exec
M1Sales Mgr
Consistent families & levels — fully governed
Power every comp decision
One governed source feeds benchmarking, planning, equity, and hiring.
Benchmarking
Accurate market matches
Planning
Live data for pay cycles
Pay Equity
Comparable worth by level
Recruiting
Same governed source
JOBNAV
One Source

Reduce the back-and-forth between HR, managers, and compensation


Create one governed source of truth for job content, pay guidelines, and offer history — so everyone works from the same playbook.

  • Shared job descriptions and levels across HR and Comp
  • Clear approval workflows that don’t rely on email chains
  • Visibility into how pay decisions are being made across the organization
Outcome
Less chasing. More alignment.

Partner with experts when you need it most


You don’t have to build everything from scratch. Many HR teams want expert support on job architecture, manager enablement, pay equity strategy, or compensation communication — without adding headcount.

  • Job architecture and leveling design that supports both equity and manager clarity
  • Manager compensation training and enablement programs
  • Pay equity strategy and communication planning
Outcome
Move faster on strategic initiatives while building internal capability.
1Model
2Enable
3Implementation
Build a defensible merit matrix
Specialists model increases by performance and position in range — calibrated to budget.
Expert matrix
MERIT MATRIX · INCREASE GUIDELINES
Performance
Below
midpoint
At
midpoint
Above
midpoint
Exceeds · top tier 5.0% 4.0% 3.0%
Meets · solid 3.5% 2.5% 2.0%
Developing · building 2.0% 1.5% 0.0%
3.0%
Calibrated to your merit budget
Defensible and consistent — ready for leadership sign-off
Turn managers into confident decision-makers
Recommendations checked against the matrix — guardrails catch inequity before it ships.
Guided calibration
CALIBRATION REVIEW · PROPOSED INCREASES
AC
Ariana Acosta
Exceeds · below midpoint
5.0%
IN RANGE
DK
Drew Kent
Meets · above midpoint
2.0%
IN RANGE
ST
Sophia Thorpe
Developing · above midpoint
4.5%
OVER GUIDE
🛡
Guardrails flag the outlier
One increase exceeds guidelines — caught before sign-off, not after.
Roll out new cycles — without the chaos
Custom change management and enablement so new processes stick and deliver fast.
Change management
IMPLEMENTATION & ENABLEMENT
A cycle your team runs with confidence.
Hands-on manager training
Productive pay conversations, no inequity
Calibration sessions leadership trusts
Fair, consistent, defensible decisions
Change management built in
New cycles stick and deliver value fast
From fair matrix to a cycle that sticks — without adding headcount.
✦ Why Payscale

Don’t just take our word for it

Hear from leaders how Payscale delivers for clarity, scale, and trust in their compensation strategy.

500+ 5 Star Reviews

Ready to enable managers instead of chasing them?

See how Payscale helps HR and People teams reduce friction, improve consistency, and build fairness into everyday compensation decisions.

Learn More